
Using charts, you can display session data visually in a Dynamic Document instead of listing it as plain text. Charts are useful for summarizing numeric data — like a loan payment breakdown for auto financing, a coverage comparison for an insurance policyholder, or a usage summary for a telecom account — so the customer can grasp key figures at a glance instead of reading through a block of numbers.
Each chart is built from one or more series, where each series is mapped to a numeric Attribute. When the session runs, the chart populates automatically from the customer's data.
Note
Charts are currently supported in Dynamic Documents only. They are not available in visual cart Dynamic Documents or PDF Templates.
Add a chart
To add a chart:
In the HTML designer, place your cursor where you want the chart to appear.
Click the Chart icon in the toolbar.
.png)
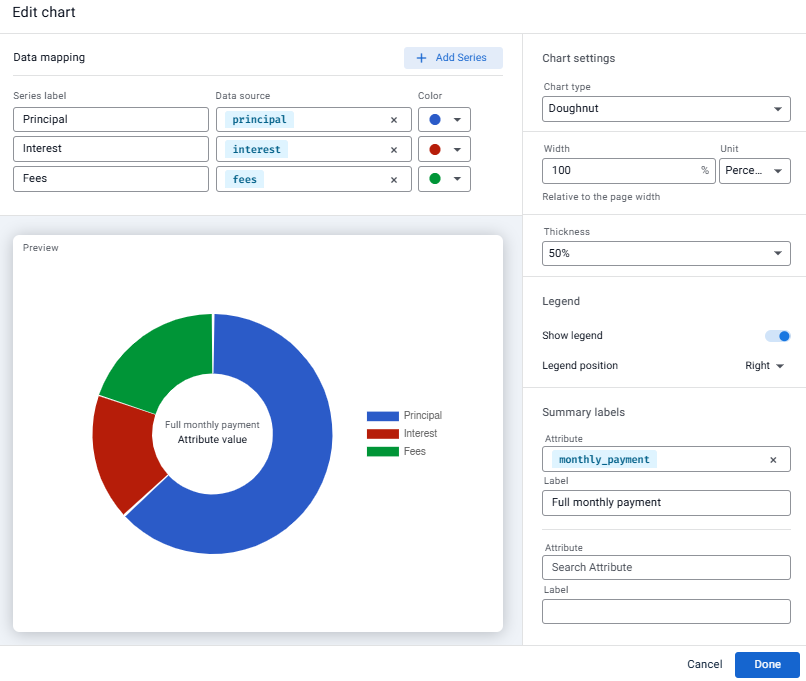
The chart configuration dialog opens.Under Data mapping, add a series:
Enter a name for the series.
Select a number Attribute for the data source.
Select a color to represent the series.
Click Add series to add additional series and repeat step 3 for each one.
Under Chart settings, configure the following appearance settings:
Chart type — select Bar, Stacked bar, or Doughnut.
Width — the width of the chart, set as a Percent (relative to the page width) or Pixels (fixed).
Thickness (Doughnut only) — the thickness of the middle of the doughnut ring, as a percentage of its radius.
Direction (Bar and Stacked bar only) - select the direction of the bars: Horizontal or Vertical
Show legend — turn on to display a legend listing each series and its color.
Legend position — where the legend appears relative to the chart (e.g. Right).
Summary labels (Doughnut only) — up to two Attribute/Label pairs to display at the center of the chart. Each can be any Attribute — not limited to the ones used in the series. For example, select an Attribute that aggregates the full monthly payment, with the label "Total Payment."
Preview the chart to confirm it reflects the expected structure and layout.
Note
The preview is a simulation. Actual values populate only during a live session.
Click Done.
A placeholder appears in the document..png)
Edit or delete a chart
To edit or delete a chart:
Select the chart.
Click the icon in the context menu.
.png)